
Introduction. The world has witnessed an unprecedented development in the XXI century in the field of solar cells industry. Between 2010 and this year in Russia was conducted many studies, which aims to raise the efficiency of solar cells and in this period the focus was largely on amorphous and nanocrystalline silicon solar cells (a-Si:H/nc-Si), due to the relatively high efficiency and rival for the rest of the other types in terms of economic cost. Indeed, the efficiency of these cells increased to 11.4 % [1]. It is expected to boost the efficiency to 14% by including polymorphous silicon (pm-Si:H) layers of the structure of the solar cells a-Si:H/nc-Si [2]. In the near future is counting on these cells in the construction of large PV power station (more than 1 MW). This trend according to the features of these solar cells enjoy beside the broad absorption spectrum characteristic compared to monocrystalline silicon solar cells.
It is well know that performances of a given Photovoltaic (PV) station are strongly dependent on the climate conditions at the system setting. The most important parameters influencing these performances are the solar radiation impinging at the surface of the PV modules and the ambient temperature that effect losses from these modules.
There are many programs used in determining the productivity of PV stations. A famous of these programs is Photovoltaic Geographical Information System (PVGIS), which was create by the European Joint Research Centre. Advantage of this program is a long-term experience for monitoring and testing of various solar module according geographical location. However, this program does not take into calculate the effect of temperature on the performance of a-Si:H/nc-Si, which in recent years have gained widespread. As well as for other solar modules, does not calculate temperature change according to the change of the wind speed.
The aim of this paper is to write a program that calculates the productivity of solar PV power stations for all types of solar cells and for any area on the earth’s surface, taking into consideration climate conditions such as the degree air temperature, wind speed and humidity.
Measurement of Meteorological Variables. The main key to extrapolate the data of solar power stations is to determine accurately meteorological data of the study area. There are two methods to get meteorological information, which are then use in calculations PV stations:
- Ground measurements
- Calculations based on satellite data
The first method is to install devices in the area where you want to study and these devices are registration of solar radiation data, temperature, humidity and wind speed.
Ground station measurements give the best results, but their number is limited, they are mainly in the cities and populated areas. Therefore, the adoption of data to be true near these stations and areas that are not located more than 5 kilometers.
The second method is calculations based on satellite data. There are a number of methods to estimate the solar radiation at ground level using data from satellites. Typically, the satellites measure the light (visible or infrared) coming from the Earth. This light is mainly the light reflected from the ground or from clouds. The calculation of the solar radiation at ground level must therefore be able to take into account the radiation absorbed by the atmosphere as well as that reflected by clouds. Different types of satellites can be used to estimate solar radiation. Geostationary weather satellites take pictures of the Earth at short intervals (every 15 or 30 minutes) so have a very good time resolution. However, each pixel in the picture typically represents a rectangle a few km on each side, so the estimate of solar radiation for each pixel will be the average of such an area. Polar-orbiting satellites fly closer to the Earth, so the space resolution is better. However, they do not stay permanently above a particular area, so they are normally able to take only a couple of pictures a day of a given area [3].
The main advantage of satellite-based methods is that they give a fairly uniform coverage of large areas while ground stations are often very far apart. On the other hand, there are potential problems also with the satellite methods:
- Snow on the ground is a special problem for satellite methods, since snow will look very much like clouds in the satellite images. There are methods to overcome this problem, but the uncertainty is higher in areas with snow.
- In mountain areas one pixel may cover an area with strongly varying altitude. The solar radiation dependence on altitude is not well represented in the satellite-based calculations.
- When the sun is very low in the sky the calculation from satellite data becomes very difficult. This can cause problems, in particular in winter at high latitudes.
The quality of satellite-based estimates must be checked by comparison with high-quality ground station measurements.
Photovoltaic Power Stations Program (PVPSP) proposes a scientific solution to estimate the daily solar radiation accurately value. The solution is to make a correction value of solar radiation through:
- Calculate the daily solar radiation value theoretically from equations (Variables here are Location, Altitude, Time and Date).
- Registration temperature, humidity and wind speed data from ground stations or satellites.
- Calculate the losses of theoretical solar radiation according to three variables (air temperature, humidity and wind speed), where the change in the value of any of this data is accompanied by a change in the other data values as follows:
- Wind speed function in the temperature [(Vair) = f(T)];
- Temperature function in humidity [(Tair) = f(H)];
- Solar radiation functions in humidity and wind speed [(R) = f(H, Vair)].
On the basis of the above information it can be said that:
- The wind speed increases the possibility of result dust formation in the atmosphere and thus deficiency the amount of beam solar radiation connecting to the earth’s surface
- Increased humidity lead to increase ratio of absorption in layers of the atmosphere and increase the percentage reflection beam of solar radiation return back to space.
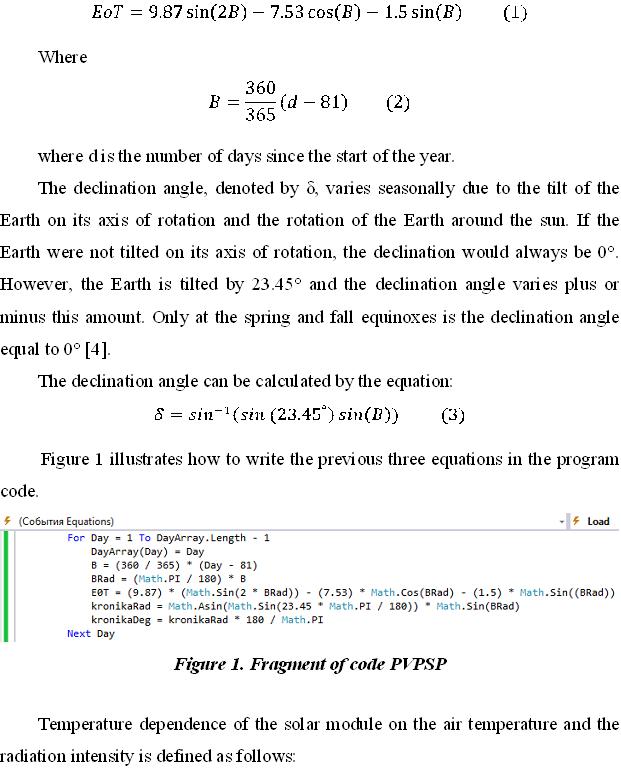
Some basic equations used in PVPSP. The equation of time (EoT) (in minutes) is an empirical equation that corrects for the eccentricity of the Earth’s orbit and the Earth’s axial tilt:
Contents of the program and explain interfaces. PVPS program written in Visual Basic (2013), which is widely used in solving mathematical calculations and researches. PVPSP is designed for scientific and commercial purposes. Interfaces and reporting program in English, Russian and Arabic language.
The PVPSP can be calculated:
- The intensity of solar radiation incident on any point on the planet at different angles at different times of the year;
- Loss of solar radiation due to angular reflectance effects;
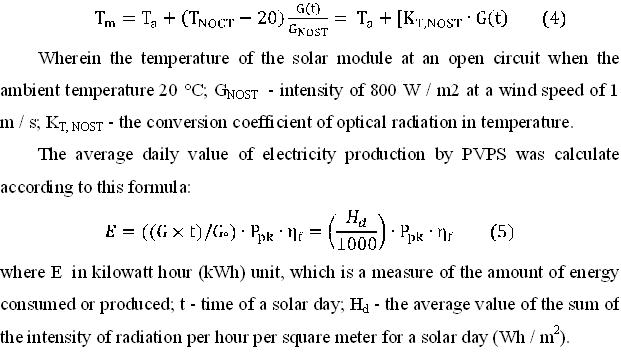
- The average temperature of any solar panel during the year due to data on air temperature, solar radiation and wind speed;
- The number of solar panels which will be used in solar power stations;
- The total area of panels for solar power stations;
- Productivity of solar power stations (from 1 kW to 250 mW) during the year with different angles of solar panels positions (by the horizon, latitude, selected angle and monthly correction angle position of solar panels depending on changes in azimuth for each month).
The first interface for entry and exit from program. Figure 2 illustrates the first interface.
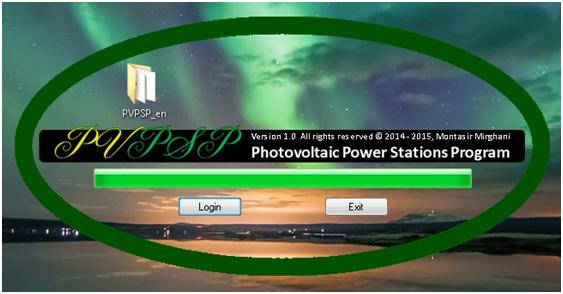
Figure 2. The first interface PVPSP
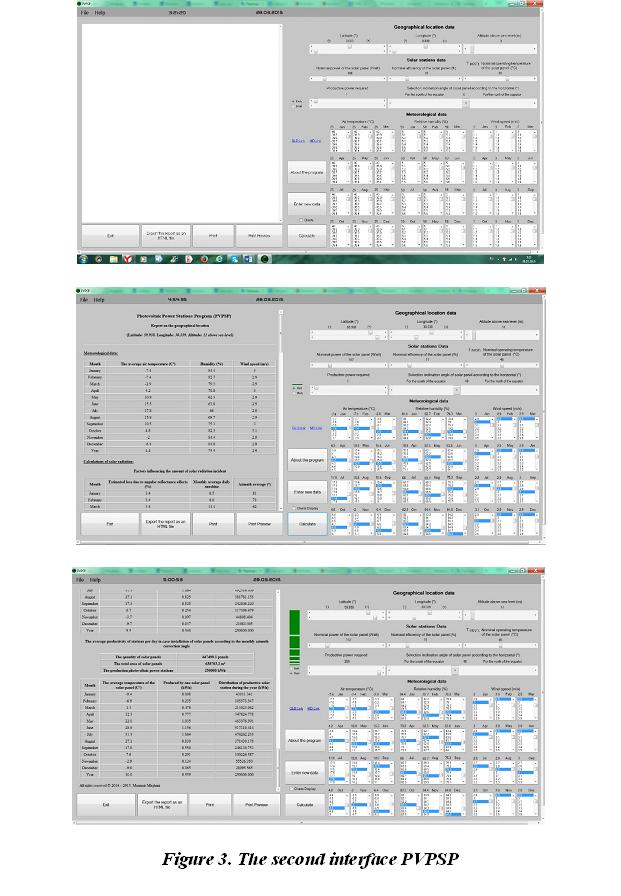
The second interface for data entry and view the results. Data entry for the program in three stages:
- Geographical location data, which contain Latitude, Longitude & Altitude. These data can be obtained from the GLD link with a blue color in the second interface (Figure 3 – a).
- Solar station data, which contain Power, efficiency & TNOST of solar panel. This information is located on the backside of the solar panel. In solar radiation data, it also contain information about selection angle of solar panel and productive power station required.
- Meteorological data, which contain Air temperature, Relative humidity & Wind speed. This information is also can be obtained from the MD link.
Through this interface can access to the third interface, which contains information about the program and how to use the program.
Figure 3 represents a picture of the second interface program before entering data and after entering data for St.Peterburg City – Russia, and for to productive power station (1kW , 1MW).
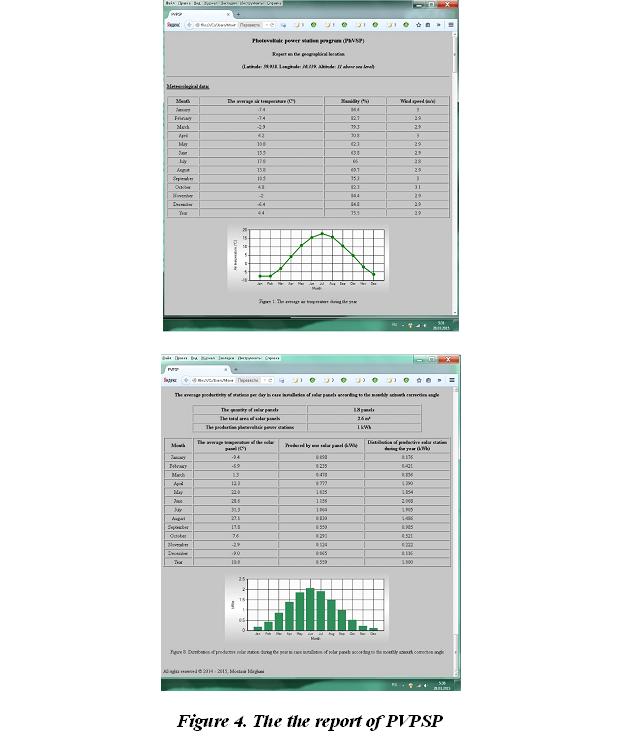
The report of PVPSP. The program generates a report in HTML file with the desired graphics for print and the ability to insert the script report in websites.
Figure 4 illustrates the report of PVPSP for St.Peterburg City – Russia (1kW — station based on a-Si:H/nc-Si panels). The report contains seven Pages with seven tables and eight graphics.
Conclusion. The main results are summarized as follows:
- Can be explore any point on the planet from the equator to the north pole and the south including land and water.
- Convenient interface, in which the maximum reduced data entry errors for fair calculation.
- In comparison with the program PVGIS, PVPSP gives more accurate results of solar power capacity by determining the temperature of the solar panel is dependent on a number of factors (solar radiation, the angle of incidence of solar radiation, wind speed).
- report is generated in the form of an HTML file which enables insert the script report in websites.
References
- В.П. Афанасьев, Е.И. Теруков, А.А Шерченков. Тонкопленочные солнечные элементы на основе кремния. 2-е изд. СПб.: Изд-ов СПбГЭТУ «ЛЭТИ», 2011. 15 с.
- Бадрелдин-Миргхани М.М., Семенов А.В., Терентьева В.Н., Теруков Е.И., «Оптические и фотоэлектрические свойства тонкопленочных пленок полиморфного гидрогенизированного кремния» // Сборник трудов II Всероссийской научной конференции «Наноструктурированные материалы и преобразовательные устройства для солнечной энергетики 3-го поколения», Чебоксары. 2014. С.76-79.
- Photovoltaic Geographical Information System. , European Commission. 2002 – 2014.
- Photovoltaic Education Network. , 2014.[schema type=»book» name=»PHOTOVOLTAIC POWER STATION PROGRAM» description=»Photovoltaic Power Stations Program PVPSP proved to be a reliable tool for calculations also has an intuitive interface and a practical display of the results, it enables calculate the intensity of the solar radiation incident on any point on the planet at different angles at different times of the year. , the total area and number of panels and productivity solar power (from 1 kW to 250 mW) during the year with different angles of position of solar panels.» author=»Mirghani M. M.» publisher=»БАСАРАНОВИЧ ЕКАТЕРИНА» pubdate=»2017-04-22″ edition=»ЕВРАЗИЙСКИЙ СОЮЗ УЧЕНЫХ_ 28.03.2015_03(12)» ebook=»yes» ]