
On the 1st of May, Latvia became a member of the European Union. Yearly installments of Latvia to the budget of the EU make about 310 -355 million Euro; at the same time by the means of various funds and financial support of Latvia is returned about 850 million of Euro annually. These amounts are divided among the following directions: the development of infrastructure is 38.4%, human resources is 32. 5%, structural reforms, competitiveness, innovations are 29.0% [10].
Due to the European funding (through the European Regional Development Fund, European Social Fund and Cohesion Fund) which were allocated for the equalization of living standards, the Latvian entrepreneurs were able to upgrade their equipment, to enter new markets of sale and to expand production capacities. Latvia gets funds within the frameworks of two communal EQUAL and INTERREG initiatives, from the European Development Fund of agriculture and from the Development Fund of fish culture.
As an economic development is multifactorial process that reflects the changes in all fields of economic life of the country, let’s consider the current state of the Latvian economy through some economic indicators for 2004-2014.
The key indicators of the economic development of the country are GDP per capita. Let’s consider the nominal GDP and GDP at parity of purchasing power (PPP) (figure 1).
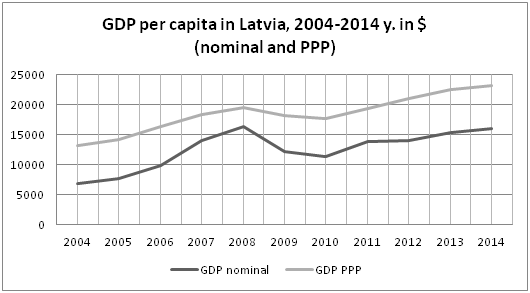
Figure 1. GDP per capita in Latvia, 2004-2014 y. [16]
As it can be seen from the figure 1, the nominal GDP and GDP per capita since 2004 increased from 6746.06$ to 16037.78$ and GDP on PPP from 13130$ to 23150 $. In Latvia the level of GDP per capita on PPP has already reached 64 percent of the average level in the EU, while, at the moment of joining the European Union, it makes only about the half of the European level. For example, the GDP per capita on PPP in Latvia exceeds the level of Bulgaria. It approaches to the level of such countries as Poland and Hungary, but at the same time it began to lag behind the similar indicators of Lithuania and Estonia. The GDP growth per capita is ahead of volume growth of the economy due to the fact that the population is declining in Latvia.
Let’s consider the development of GDP of Latvia for the period of 2004-2014 (figure 2) which characterizes the final result of production activity of economic units – residents and measures the cost of goods and services, produced by these units for the final use.
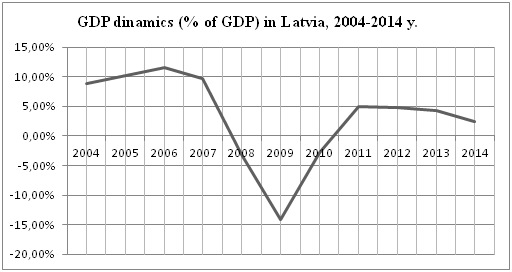
Figure 2. GDP dinamics ( % of GDP) in Latvia, 2004-2014y. [16]
From 2004 until the first half of 2008 it was the fastest growing economy throughout the EU, having reached the GDP growth in 12.2% in 2006. During this period the main impetus of growth was the consumption in the private sector and the growth of investments which were based on the essential inflow of external capital. In 2008 and 2009, in the result of global financial crisis, the inflow of external capital was stopped and the recession began in Latvia. During the crisis the gross domestic product (GDP) fell by ¼. In 2009 Latvia experienced the sharpest economic decline among the EU countries – 18%.
Latvia, as any developing country is developing faster than any developed country of the EU (about 3.38% on the average for 2004-2014). The trend of the economic development of the EU countries is the same (about 1.7% on the average for 1990-2013): economic upturns and crisis are experienced almost equally, the only difference in figures.
Note that in the conditions of falling of domestic demand and reduction of economic growth, the indicators of inflation, with some exceptions continue to fall from 6.2% in 2004 to 0.7% in 2014 [17].
Let’s consider the state debt of Latvia (figure 3):
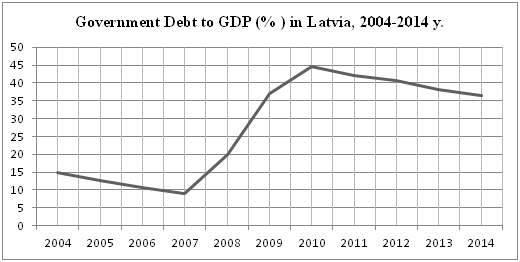
Figure 3. Government Debt to GDP (%) in Latvia, 2004-2014 y. [16]
The state debt of Latvia began to form in 1992, when the loan of the World Bank was taken. The amount of debt until 2007 was small (9% of GDP), but since 2008 was marked its notable increase, as were taken the first loans from the International Monetary Fund because of the budget deficit, including the provision of liquidity of Parex banka after its adoption by the state. At the end of 2014 the state debt reached 38% of GDP, it is more than 7 bln EURO. Note that the Maastricht criterion provides that the debt shouldn’t exceed 60% of GDP, in Latvia 35% — 40%.
Here it is necessary to describe some of the indicators of quality of state management of Latvia which have influence on the economic situation of the country – unsatisfactory indicators in the field of Control of Corruption, Political Stability and Absence of Violence/Terrorism. According to the international estimates, the biggest problem in Latvia is corruption which is extended to all levels of power. The non-purpose distribution of the European funding takes place, as well as some part of the EU funds “hangs” on the state account with the rational direction.
Note that the participation of government of Latvia in political games of the EU and USA has a negative influence on the trading relations with some major trading partners (using the example of CIS). The largest partners of Latvia on export are Lithuania, Estonia, Russia, Germany, Sweden, Poland, Denmark and Great Britain. In general, in the EU countries Latvia exports 71.0% of total export volume.
The partners of Latvia on import are Lithuania, Germany, Russia, Poland, Estonia, Finland and Belarus. From the countries of the European Union was imported 79.7% of the total volume of import. The basic industries of export are: wood industry, metal industry and engineering, electronics and electrical engineering, chemical industry, food industry.
Let’s consider the detailed indicators of export and import of Latvia for 2004-2014 (figure 4).
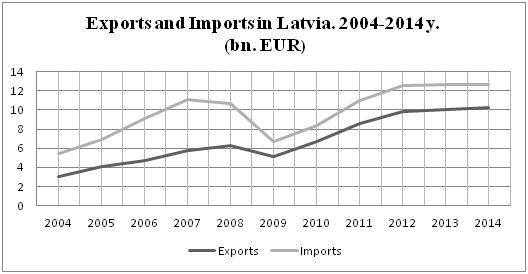
Figure 4. Exports and Imports in Latvia. 2004-2014 y. [11]
After the global financial crisis the export of goods renewed its stable growth. The growth of export was faster than before the crisis that allowed in the shortest possible time returning to the level of 2008. In 2010 the export of goods in the actual prices increased by 30% in comparison with 2009 and by 6% in comparison with pre –crisis 2008. In 2014 the volume of export of goods made 10.24 bln Euro and the growth of volume of export in the actual prices reached 28%.
Under the influence of the financial crisis significantly has reduced the negative balance of foreign trade of goods. If at the end of 2006 the import of goods exceeded the export of goods by 2 times, then, at the end of 2011 the predominance of import over the export decreased up to 22%. Note that on the average in the EU countries (especially in developed ones) export mainly according to the indicators is higher than import.
The main products of export of Latvia are wood and wood products (about 16% of the volume of export of goods); metals and metal products (14%); machinery and equipment; electrical equipment (12%); mineral products (9%) and products of chemical industry (7%).
The main products of import of Latvia are the mineral products (about 17% of the volume of import of goods) machinery and equipment, electrical equipment (17 %); metals and metal products (10%); products of chemical industry (9%) and vehicles (9%).
If to consider the sources of direct foreign investments in Latvia, then, the main sources of direct foreign investments in Latvia are the neighboring countries of the Baltic Sea region which operate in Latvia since the beginning of the 90s. Currently, the investments from Sweden, Germany, Denmark, Estonia and the Netherlands make 42.4% of the total volume of direct foreign investments (FDI), covering many areas, from finances, telecommunications and trade to the creation of fully export – oriented production [9].
After 2004 the western investments went mainly to the banking sector and the trade, in the mortgage construction – everything that gives you an instant profit. Latvia has been covered by tsunami of cheap European goods; the Latvian enterprises have been limited by production quotas.
The main reasons of the heightened interest of the European states to the investment in the Latvian economy remains a significant difference between the costs of production in the countries of East and West, as well as the striving of investors to strengthen their presence in the promising and intensively developing market of the Baltic States. Not the last role here also plays an opportunity of strategic penetration of business in the CIS countries and Russia. The countries, located in the east, mainly, Russia have chosen Latvia for transit/logistical operations to get the added value for its main export goods – oil products, chemicals and metals.
The volume of the accumulated FDI at the end of 2014 – 12 bln euro that is more in 8.7 bln euro, than in 2004 (3.3 bln euro). Since the beginning of 1990s Sweden in Latvia is the largest investor (more than 20% of the total investments, while the investments of the other countries don’t exceed 10%).
Note that the largest land plots belong to the Norwegian Storebrand Livsforsikring AS (49 306.59 hectares of the Latvian land, on the third place is the Swedish enterprise Bergvik Skog AB).
At the moment about 15% of all land is bought by foreigners. As for forests, then their total area in Latvia makes 3.2 mln hectares. 50% belongs to the state enterprise Latvijas valsts meži (which in particular rents forest to the same Scandinavians, for example, for a term of 99 years).
Furthermore, about 13% of the Latvian forests are in the ownership of foreigners. The Swedish enterprise Bergvik Skog belongs 100 thousand hectares of the Latvian forests. About 38 thousand of hectares of forests are in the ownership of Norwegian Foran Real Estate and else 12 thousand of hectares are in the ownership of Phemus Corporation.
At the end of 2013, Sweden invested in the basic capital of the Latvian banks 1.088 bln euro (44.5% of the total paid basic capital), Norway 191.178 mln Euro (7.8%) [6]. Western economists point out that the transnational corporations are actively intervene into the law making processes in the host countries, incline to ignore the ecological and labor legislation, rely mainly on foreign suppliers, don’t neglect even the services of local corrupt officials [7].
According to the data for 2015, Latvia ranks the 39th place in the world for quality of life. Higher of Latvia in rank, according to the data of the research of Numbeo are the other Baltic countries: Estonia – in the 21st place, Lithuania – in the 32nd place. The index of Latvia makes 99.04. Quality of life index was determined by several criteria, including, the cost of living, real estate prices, criminality, health care, ecological level (air emissions), transport and travels.
Let’s consider the level of unemployment which will complement the understanding of current situation in Latvia (figure 5).
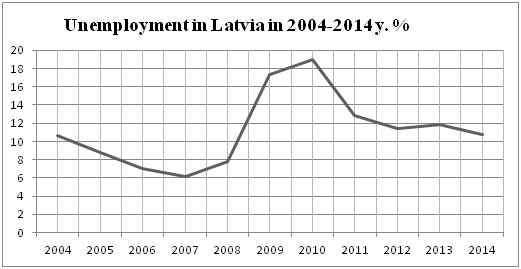
Figure 5. Unemployment in Latvia in 2004-2014y. ( % ) [3]
The total size of the labor market of Latvia makes 966 thousand of people, who are concentrated mainly in the largest cities: Latvia, Daugavpils, Liepaja and Yelgava. In the period of economic recession in 2008 – 2010, the situation in the labor market significantly deteriorated. Since the beginning of 2010, gradually increased the economic activity, situation in the labor market improved – increased employment, gradually decreased unemployment and increased the number of available jobs. The overall unemployment rate in 2014 fell up to 10.8% (for the comparison – the level of unemployment in 2013 – 11.9%). Note that the increase of unemployment, relative impoverishment of masses on the one pole and the growth of wealth, concentration and centralization of capital on the other is the law of reproduction of bourgeois society [12].
As it is known, the Gini coefficient is a macroeconomic indicator which is characterized by the differentiation of cash income of the population in the form of degree of deviation of actual distribution of incomes from absolutely equal of their distribution between the inhabitants of the country [1]. The Gini coefficient in Latvia remains the highest in the European Union, despite its decline in the period from 2008 to 2012. In 2014, the index value of Gini in Latvia was the highest among the EU member states (35.2%), reflecting the greatest inequality of distribution of incomes among the different population groups. It should be noted that the index of Latvia in 2004 was 34.96 and it gradually increased up to the abovementioned indicator [4].
We also note that according to the researches of economists of the regions of Latvia, the lowest level of inequality, i.e., the lowest Gini coefficient has Kurzeme and the highest indicator of inequality has Riga and Riga district, show the results of the research “Latvian regions of 2004 – 2012”.
Riga region as the “center” is characterized by: the strong concentration of socio – economic activity in a single point of the territory of the country. More active, in comparison with the rest territory of Latvia, the use of new technologies (informational, financial and intermediate, production, management); a significantly higher level of incomes of the population; the high specific gravity of investments, working on the further development of the region; a higher level of socio – economic and socio – cultural capital [15]. In Riga region which concentrates 66.8% of GDP of the country (the rest regions from 7% to 10% each), 64.0% of industrial production of the country (the rest of the regions – from 7% to 14%), 69.0% of nonfinancial investments of the country (the rest of the regions – from 6% to 12%), 48.6% of permanent residents of the country (the rest of the regions – from 10% to 15%) [11].
According to the estimates of the forecast of demographic situation in Europe for a period of up to 2060, published by the European Commission, in the next 50 years Lithuania and Latvia will be the leaders in extinction of the population among the EU countries: the number of residents of these countries will be reduced by 30%, respectively [2]. The major problem, associated with the demographic challenges for Latvia is the social welfare of the population. The budget of Latvia is unable to cope with the growing obligations to the residents and the ruling elites refuse banknotes of additional funds for health care and indexing of pensions. At that, the international Monetary Fund and the European Commission recommend to Latvia to follow the way of increase of taxation in order to have an opportunity to continue social benefits.
Most of the experts say that the largest payment of Latvia for the membership in the EU it is a migration. Despite the transitional period which was set for the migration in the developed countries of Europe – Germany, France and others – for 10 years has left about 400 -500 thousand of people.
Furthermore, the changes in the structure of the population, described in the forecast of the European Commission show that by 2060 in Latvia the number of people, who is older than sixty five years will make almost one third of the population. Thus, Latvia will lead the list of the most “actively endangered” EU countries.
About the level of economic development of country is also judged on the basis of sectorial structure of the economy. The high share of processing industries is a sign of high level of economy [14]. However, the most significant part of Latvia’s GDP about 70% is the sector of services, the share of manufacturing industry in the state economy makes 14.1% of GDP, trade – 16.9%, industries of transport and storage – 13%, the construction industry – 6.1% [8].
According to the data of index of assessment of the business environment („FICIL Sentiment Index 2015” examines the indicators in such areas as demographics, access to labor, education, science, added value, legislation and state support) the foreign investors in Latvia most of all are worried about the demographic indicators. According to the five – grade scale the demographic situation in Latvia were estimated at two points, health care and social safety at 2.6 points, the quality of education at 2.8 points, the quality of labor force got 3 points. Demand for products and services was estimated at 3.1 points, the basic infrastructure at 3.2 points, the quality of legislation, regulating the business – at 3.2 points, attitude towards the foreign investors at 3.2 points, the efficiency of the labor force at 3.2 points [5].
Prepared by the Organization for Economic Cooperation and Development (OECD – the coordination of projects of economic reconstruction of the Europe within the frameworks of the Marshall plan) the review of the economy of Latvia in 2015 revealed the following interferences for joining in its ranks:
- low labor productivity;
- one of the highest levels of inequality of incomes;
- the highest labor taxes (higher in Hungary), the difference between how much earn the employee and how much he /she costs for employer, makes 40% [13].
By the order of the Ministry of Finance of the Latvian Republic LLC “Stockholm School of Economics in Riga” estimated the influence of financing of the EU funds on the economy of Latvia. According to the results of research the EU funds reduced and amortized the fall of the economy during the crisis, as well as have the positive influence on the stabilization and subsequent growth of the national economy. In the period from 2004 to 2011 the average growth of GDP, caused by the use of the EU funds made 3.9%. The greatest influence on the growth of added value has in the fields of construction (5.3%) and private services (5%). Funds also stimulated an increase of labor productivity by an average of 2.9% per year, as well as the growth of employment of the population by an average of 1% per year.
Conclusion
On the basis of considered socio – economic level of Latvia, we identify the main trends.
Latvia, despite the European funding hasn’t approached to the average level of living standards of the EU. The standard of living has increased minimally – an indicator of the national wealth per capita increased from the mark of 56% to 62% of the average level of the EU. After the independence and joining the EU, Latvia has lost its economic potential, as well as according to the level of development has appeared in the last places among the EU member countries.
The lack of required quality of state management is rather causes the degradation of the population than its development. At that, there is an evident merger by the foreign investors (mainly from Scandinavia) of economic units of Latvia (mass media, banks, real estate, communications) that has a negative influence on the living standards of the population and the economy as the whole.
The deterioration of the balance of payment, caused by the profit repatriation, negative social consequences, the loss to a certain extent the political influence and unemployment also have a negative influence on the economic security of Latvia.
On the basis of the above mentioned, for the improvement of level of socio – economic development, the author considers that it is necessary to give the following recommendations:
- the decrease of burden of taxation that will increase the employment of the population and will drive up the demand for goods and services;
- the association of ethnic layers of society by the means of development of national idea;
- the substitution of “insolvent” members of state management by the higher educated and talented candidates;
- the reduction of the state apparatus and the redirection of the released financial means for the development of infrastructure and production (partial import substitution);
- the reduction of allocation of funds for defense and redirection of them to raise the level of education of society with the connection of the mass media to decrease the various kinds of dependences of the population (credits, alcohol, drugs, etc.) and moral health care of society;
- the reduction of dependences on foreign investors (banks, mass media, real estate) revealing your own healthy development strategy of the country;
- alignment of trade and political relations with neighboring countries (the CIS, as well);
- the development of complex of legislative initiatives for the development of forestry, tourism, information technologies, export of medical services and other industries of the economy to increase the export of goods and services, increase of their competitiveness and labor productivity.
References
- Academic Dictionaries and Encyclopedias. URL: https://dic.academic.ru/dic.nsf/econ_dict/18262
- Analitical portal RuBaltic.Ru. URL: https://www.rubaltic.ru/article/ekonomika-i-biznes/18052015-demografia/#t20c
- CIA World Factbook. URL: https://www.cia.gov/library/publications/the-world-factbook/
- URL: https://ec.europa.eu/eurostat/tgm/graph.do?pcode=tessi190&
- «FICIL Sentiment Index 2015». URL:
- Financial and capital market commission. URL:
- Grishin А. Changing role of the state in the context of globalization. Seminarium hortus humanitatis. URL:
- Informational portal Balticexport.com. URL:
- Investment and Development Agency of Latvia. URL:
- Latvian regional economic development: problems and perspectives. URL:
- Latvian statistics. URL:
- Marks К. Capital. Т. 1. Ch. 23 // Marks К., Engels F. Т. 23. – 58 p.
- News portal „Latvijas Sabiedriskie mediji”. URL:
- Shaika L. State Regulation of Economy. 2006. – 435p. URL: https://banauka.ru/27.html
- Voronov V. Evaluation and growth factors of innovative competitiveness of Latvian regions. Journal “Actual problems of innovative development”. URL: https://journals.kantiana.ru/
- World bank. URL: https://www.worldbank.org/eca/russian/
- World economic. Ereport.ru. URL: type=»book» name=»Socio – economic level of development of Latvia after joining the EU» description=»The article examines the dynamics of some socio – economic indicators which characterize the level of development of Latvia after joining the state to the EU. The reasons and factors, contributing to the change of the socio – economic level of the country are shown. Recommendations for the improvement and stabilization of the economic development of Latvia are given. » author=»Zaitseva Elena Ivanovna» publisher=»БАСАРАНОВИЧ ЕКАТЕРИНА» pubdate=»2016-12-28″ edition=»euroasia-science.ru_26-27.02.2016_2(23)» ebook=»yes» ]