
- Introduction
The climate of a place is normally concerned with the weather conditions of the place, over a long period of time. Since weather depends on numerous factors which vary with time, it is right to talk of a climate change. Climate change is bound to have some effects on the social and technological standards of living in the countries where it occurs. Madueme (1999) indicated that the developing nations of Africa, Asia and South America are bound to be seriously affected, in the event of climate change, and so ought to be interested in the subject [1, p. 1].
The decrease and scarcity of water resources in the Middle East due to increased demand have negative effects on the economic development and prosperity and thus affect political stability in the region [2, p. 261]. Until 1970, Iraq was excluded from the neighboring countries that suffer from water scarcity due to the presence of the Tigris and Euphrates rivers despite the fact that in mid- seventies the Syrian cut the Euphrates water to impound some of their reservoirs [3, p. 54]. The idea of construction of irrigation and flood control systems in Iraq were started in the first half of the twentieth century by the Board of Development created by the Kingdom of Iraq. Primarily, it was to protect Baghdad, the capital, and other major cities from flooding. The 1970 to 1990 was the best period of development of Iraq’s water systems. The process stopped in the 1990 due to the first Gulf War and UN sanctions. In 1977, the Turkish Government started to utilize the water of the Tigris and Euphrates Rivers through the South-eastern Anatolia Project (GAP). The project includes 22 multipurpose dams and 19 hydraulic power plants which are to irrigate 17,103 km2 of land with a total storage capacity of 100 km3 which is three times more than the overall capacity of Iraq and Syrian reservoirs [4, p. 670]. Eight of these dams are to be constructed on the River Tigris, only three were built (two in 1997 and one in 1998). The irrigation projects in GAP will consume about 22.5 km3 of water per year after completion [5, p. 779]. The total irrigated area in Iraq is estimated before the Iraq-Iran war and the second Gulf War to be around 40,000 km2 which decreased to 27,800 km2 after second Gulf War for the Euphrates-Tigris basin [3, p. 55]. The reduction of flow in the Tigris and Euphrates Rivers in Iraq is considered to be a national crisis and will have severe negative consequences on health and on environ- mental, industrial and economic development [5, p. 780]. In view of the above, the Iraqi Government should work to adopt effective procedures to overcome the water short- ages.
- Study Area: Hamrin Reservoir
Hamrin reservoir is located on the River Diyala 120 km northeast of Baghdad city at latitude 33°55’, 34° 30′ N and longitude 44°44’, 45° 15′ E. (Figure1).
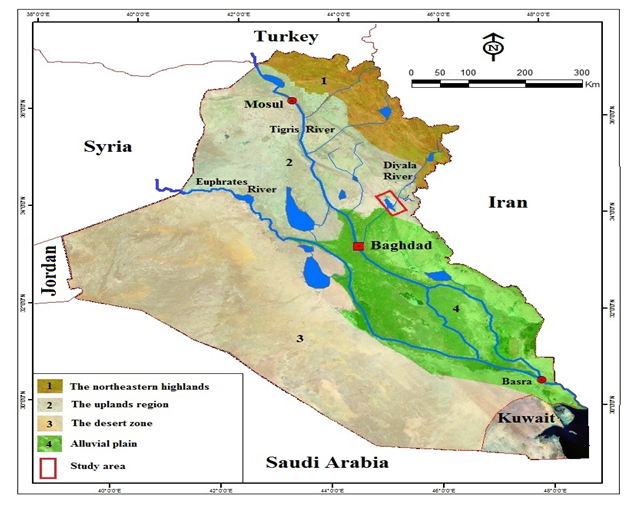 Figure 1. Map of Iraq showing the study area (Hamrin reservoir)
- Materials and Methods
3.1 Collection of data
The rainfall, reservoir inflow and temperature data. The data obtained and their corresponding years of record are presented in Table 1.
Table 1.
Hydro-meteorological data and years of records
| Period | Variable |
| 1981-2012 | Rainfall (mm) |
| 1981-2012 | Maximum Temperature (°C) |
| 1981-2012 | Minimum Temperature (°C) |
| 1981-2012 | Reservoir Inflow (m3/s) |
3.2 Analysis of Data
All the parameters were subjected to statistical and Mann-Kendall. The using the standardized coefficients of Skewness (Z1) and Kurtosis (Z2) statistics as defined by Brazel and Balling (1986) [6, p. 195]. The standardized coefficient of Skewness (Z1) was calculated as: 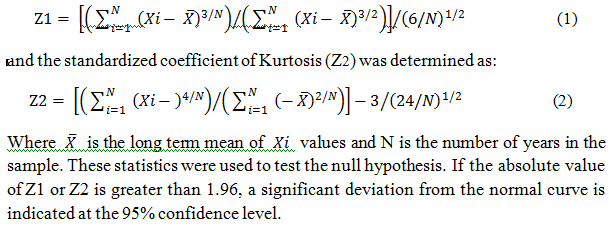
3.2.1 Statistical analysis
This involves the determination of measures of central tendencies (mean, median, range) and the measures of dispersion (standard deviation). The results of the statistical analysis are presented in Tables and Figures 2 – 5 for Rainfall, Max temperature, Min temperature and Reservoir inflow respectively.
Table 2.
Statistical summary for Rainfall, R (mm) (1981 — 2012)
| Dec | Nov | Oct | Sep | Aug | Jul | Jun | May | Apr | Mar | Feb | Jan | |
| 48.5 | 40.9 | 11.9 | 0.1 | 0 | 0.03 | 0.04 | 5.78 | 30.2 | 49 | 43.11 | 55.5 | Mean |
| 36.6 | 42.4 | 18.2 | 0.2 | 0 | 0.17 | 0.15 | 7.57 | 22.46 | 36.78 | 27.94 | 32.8 | S.D |
| 0.01 | 0.01 | 0.0 | 0 | 0 | 0 | 0 | 0 | 0.1 | 0.5 | 2.7 | 0 | Min |
| 154 | 186 | 78.5 | 0.8 | 0 | 1 | 0.8 | 27.7 | 81.6 | 123.4 | 109.1 | 118 | Max |
| 154 | 186 | 78.5 | 0.8 | 0 | 1 | 0.08 | 27.7 | 81.5 | 122.9 | 106.4 | 118 | Range |
| 2.79 | 3.91 | 4.79 | 8.8 | 0 | 12.6 | 9.7 | 3.17 | 1.60 | 1.31 | 1.49 | 0.02 | Skew |
| 1.99 | 4.01 | 4.95 | 16 | 0 | 35.2 | 22.3 | 1.32 | -0.12 | -0.91 | -0.38 | -1.1 | Kurtosis |
Table 3.
Statistical summary for Maximum Temperature, T (°C)
| Dec | Nov | Oct | Sep | Aug | Jul | Jun | May | Apr | Mar | Feb | Jan | |
| 17.9 | 24.2 | 33.7 | 40.2 | 44.5 | 44.7 | 42.05 | 36.4 | 28.9 | 22.4 | 18.0 | 15.8 | Mean |
| 2.34 | 1.97 | 1.51 | 0.91 | 1.36 | 1.15 | 1.31 | 1.76 | 1.89 | 2.48 | 1.91 | 2.16 | S.D |
| 13.8 | 18.9 | 29.8 | 39 | 42.2 | 41.6 | 39.6 | 32.7 | 26 | 17.6 | 13.4 | 12 | Min |
| 23.3 | 29.1 | 36.2 | 42.6 | 47.5 | 47 | 45.2 | 39.2 | 33.5 | 28.8 | 21.3 | 20.2 | Max |
| 9.5 | 10.2 | 6.4 | 3.6 | 5.3 | 5.4 | 5.6 | 6.5 | 7.5 | 11.2 | 7.9 | 8.2 | Range |
| 0.35 | -0.4 | -1.77 | 1.47 | 0.56 | -1.4 | 0.47 | -1.2 | 1.63 | 0.82 | -1.0 | 0.29 | Skew |
| -0.7 | 1.29 | 0.48 | 0.27 | -0.7 | 0.7 | 0.2 | -0.7 | -0.3 | 0.36 | 0.43 | -0.3 | Kurtosis |
Table 4.
Statistical summary for Minimum Temperature, T (°C)
| Dec | Nov | Oct | Sep | Aug | Jul | Jun | May | Apr | Mar | Feb | Jan | |
| 6.64 | 10.7 | 17.8 | 22.2 | 26.5 | 27.15 | 24.9 | 21.40 | 14.8 | 9.83 | 6.26 | 5.06 | Mean |
| 1.74 | 1.33 | 2.02 | 1.38 | 1.70 | 1.69 | 1.80 | 3.28 | 2.10 | 1.87 | 1.63 | 1.72 | S.D |
| 3.7 | 8.1 | 14.5 | 19.4 | 23.8 | 23.7 | 21.7 | 17.2 | 11.8 | 5.3 | 2.7 | 1.4 | Min |
| 9.2 | 13.5 | 25.6 | 26 | 29.7 | 32 | 28 | 36.8 | 20.4 | 13.5 | 9.1 | 8.7 | Max |
| 5.5 | 5.4 | 11.1 | 6.6 | 5.9 | 8.3 | 6.3 | 19.6 | 8.6 | 8.2 | 6.4 | 7.3 | Range |
| -0.9 | 0.11 | 3.78 | 0.38 | 0.22 | 1.15 | 0.73 | 7.79 | 1.80 | 0.45 | -0.3 | 0.61 | Skew |
| -1.2 | -0.3 | 7.08 | 0.80 | -1.1 | 0.97 | -1.1 | 18.4 | 0.42 | 0.20 | -0.6 | 0.03 | Kurtosis |
Table 5.
Statistical summary for Reservoir Inflow, I (m3/s)
| Dec | Nov | Oct | Sep | Aug | Jul | Jun | May | Apr | Mar | Feb | Jan | |
| 141 | 116 | 84.1 | 76.3 | 89.4 | 76.8 | 87.5 | 149.8 | 241 | 235 | 191 | 168 | Mean |
| 74.5 | 60.8 | 44.1 | 40.7 | 47.8 | 39.51 | 58.7 | 133.2 | 243 | 244 | 140 | 101 | S.D |
| 43 | 10 | 12 | 6 | 5 | 5 | 1 | 1 | 1 | 4 | 30 | 31 | Min |
| 322 | 295 | 156 | 143 | 210 | 169 | 258 | 523 | 910 | 1209 | 587 | 466 | Max |
| 279 | 285 | 144 | 137 | 205 | 164 | 257 | 522 | 909 | 1205 | 557 | 435 | Range |
| 1.82 | 2.08 | -0.7 | -0.5 | 1.28 | 0.48 | 2.48 | 2.65 | 3.26 | 5.39 | 3.24 | 2.80 | Skew |
| 0.07 | 1.60 | -1.1 | -1.3 | 0.19 | -0.1 | 2.24 | 1.25 | 1.62 | 8.49 | 1.98 | 1.62 | Kurtosis |
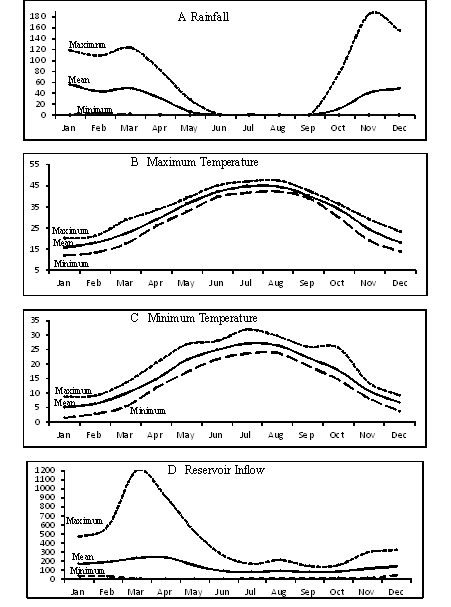
Figure 2. A rainfall, B maximum temperature, C minimum temperature, D reservoir inflow
3.2.2 Correlation Analysis
To assess the relationship between the reservoir levels and rainfall, the of Pearson’s Product Moment Correlation formula was used (Simple correlation) as shown in the equation below:

Where, X represents the independent variable X; Y represents the dependent variable Y; N the number of pairs; and r rho, Pearson’s correlation coefficient. r ranges from -1 to 1. It measures the strength of the linear relationship between y and x, a correlation value close to 0 indicates no association between the variables. R-square (?2), or the square of the correlation coefficient, is a fraction between 0.0 and 1.0. A ?2 value of 0.0 means that there is no any correlation between X and Y and no linear relationship exist between X and Y. On the other hand, when ?2 approaches to 1.0, the correlation becomes strong and with a value of 1.0 all points lie on a straight line.
The correlation coefficient of 0.04 indicates a weak relationship between the reservoir levels and rainfall because of other factors like anthropogenic factors as well as other natural factors like runoff, evaporation, inflow and outflow processes that affect the levels of the reservoir.
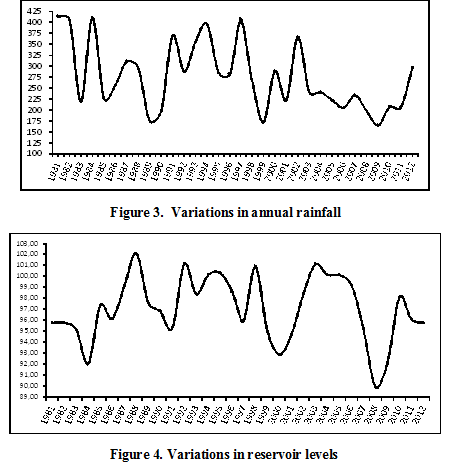
Presented in Figure 6 and 7 respectively variations in annual rainfall and reservoir Levels (1981 – 2012)
- Discussion of Results
4.1 Statistical analysis
The maximum rainfall value of the record was 185.8 mm, and the standard deviation to 77.82 mm. The maximum and minimum values for the temperature were 47.5 °C and 1.4 °C respectively, while the range of values for the standard deviation was 0.91 to 3.28 °C. The maximum and minimum values for the reservoir inflow were 1209 m3/s and 1 m3/s respectively, whiles the range of values for standard deviation was 39.51 to 244 m3/s. The statistical analysis gave the measures of central tendencies and measures of dispersions for the variables under study.
4.2 Correlation Analysis
The correlation coefficient of 0.04 indicates a weak relationship between the reservoir levels and rainfall because of other factors like anthropogenic factors as well as other natural factors like runoff, evaporation, inflow and outflow processes that affect the levels of the reservoir.
- Conclusions
It can be concluded that there is negative impact of climate change on the water resources of the study area due to decrease in rainfall, reservoir inflow and Increase temperatures. Rainy seasons in November to May; with a peak in January and March. From the analysis rainfall is not the only factor contributing to the variation in the Hamrin Reservoir. levels because of other factors like anthropogenic factors as well as other natural factors like runoff, evaporation, inflow and outflow processes that affect the levels of the reservoir.
References
- W. Salami “Assessment of the impact of climate change on water resources of Jebba hydropower reservoir using trend and reduction pattern methods” Paper presented during the 10th Anniversary Conference of Fulbright held at Conference Centre, University of Ibadan, Ibadan. 12th — 15th, Sept. 2011. pp.9.
- Naff, “Conflict and Water Use in the Middle East,” In: R. Roger and P. Lydon, Eds., Water in the Arab World: Perspectives and Prognoses, Harvard University, Cam- bridge, 1993, pp. 253-284.
- A. Al-Ansari and S. Knutsson, “Toward Prudent Man- agement of Water Resources in Iraq,” Journal of Ad- vanced Science and Engineering Research, Vol. 1, No. 1, 2011, pp. 53-67.
- A. Al-Ansari, “Management of Water Resources in Iraq: Perspectives and Prognoses,” Journal of Engineer- ing, Vol. 5, 2013, pp. 667-684.
- Issa E. Issa, N.A. Al-Ansari “Sedimentation Processes and Useful Life of Mosul Dam Reservoir” Iraq, Journal of Engineer- ing, 5, 2013, pp.779-784.
- B. Abaje “Is the changing rainfall patterns of Kano state and its adverse impacts an indication of climate change?” European Scientific Journal, January 2014 edition vol.10, No.2 ISSN: 1857 – 7881. pp.192-206.[schema type=»book» name=»CLIMATE CHANGE IMPACTS ON THE LEVELS OF HAMRIN RESERVOIR IN IRAQ» description=»Hamrin reservoir is located on the River Diyala and formed by the Hamrin dam which was built between 1976 and 1981 and commenced operation in 1981. The dam is multipurpose for irrigation, floods control and hydropower generation. The reservoir has a surface area of 489 km2 and about 50 km long, with a width 17 km. It is capable of 4.61 billion m3 of water at elevation of 107.5 m above sea level, with a live storage of 2.04 billion m3. The major source of water to the reservoir is release from Darbandikhan reservoir located about 117 km upstream and Tributaries of the Diyala River. The statistical analysis was carried out to determine the measures of central tendencies, dispersion, skewness and kurtosis. The Correlation Analysis were carried the reservoir levels and rainfall. Rainfall, reservoir inflow and temperature data obtained from Hamrin station was analysis using statistical. The results showed that there is negative impact of climate change on the water resources of the study area due to decrease in rainfall, reservoir inflow and Increase temperatures. Rainy seasons in November to May; with a peak in January and March. From the analysis rainfall is not the only factor contributing to the variation in the lake levels because of other factors like anthropogenic factors as well as other natural factors like runoff, evaporation, inflow and outflow processes that affect the levels of the reservoir.» author=»Alnuairi Bashar Hashim» publisher=»БАСАРАНОВИЧ ЕКАТЕРИНА» pubdate=»2017-06-02″ edition=»ЕВРАЗИЙСКИЙ СОЮЗ УЧЕНЫХ_ 30.12.2014_12(09)» ebook=»yes» ]